
Marketing Matters
Homes listed with Newlane outperform the competition.
Newlane Real Estate was founded to make the process of selling real estate less complicated and more efficient. We combine state-of-the-art proprietary technology with top-notch marketing.
Learn MoreNew to Market
Preview the latest listings to hit the market.

$2,022,995
8
12122 Hanson Farm Drive
North Potomac, Maryland 20878
North Potomac, Maryland 20878
5 bd / 5 ba

$1,071,000
72
1600 Gold Mine Road
Brookeville, Maryland 20833
Brookeville, Maryland 20833
6 bd / 6 ba

$839,990
29
801 Foundry Street
Frederick, Maryland 21701
Frederick, Maryland 21701
6 bd / 5 ba

$884,999
60
14 Meadowridge Drive
Myersville, Maryland 21773
Myersville, Maryland 21773
4 bd / 3 ba

$1,799,975
24
10032 Sinnott Drive
Bethesda, Maryland 20817
Bethesda, Maryland 20817
5 bd / 4 ba

$2,195,000
60
6818 Penngrove Ln Drive
Bethesda, Maryland 20817
Bethesda, Maryland 20817
6 bd / 6 ba
Careers at Newlane
A brokerage built for your success.
Our mission is to create the tools and solutions that agents need to free them from busy work, scale and grow their business, and deliver spectacular service to and exceptional results for their clients.
Learn MoreExplore Neighborhoods
Find a neighborhood that suits your lifestyle.
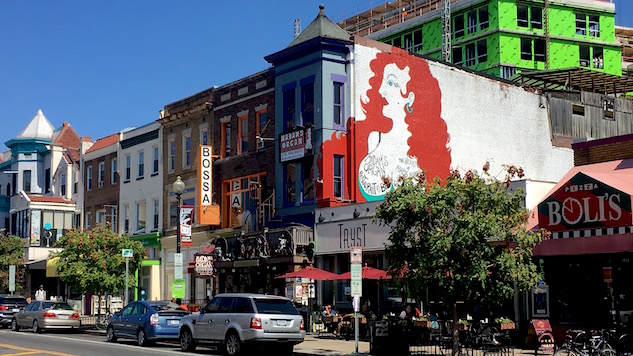
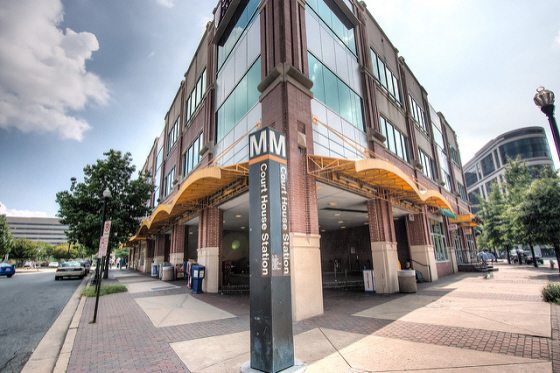
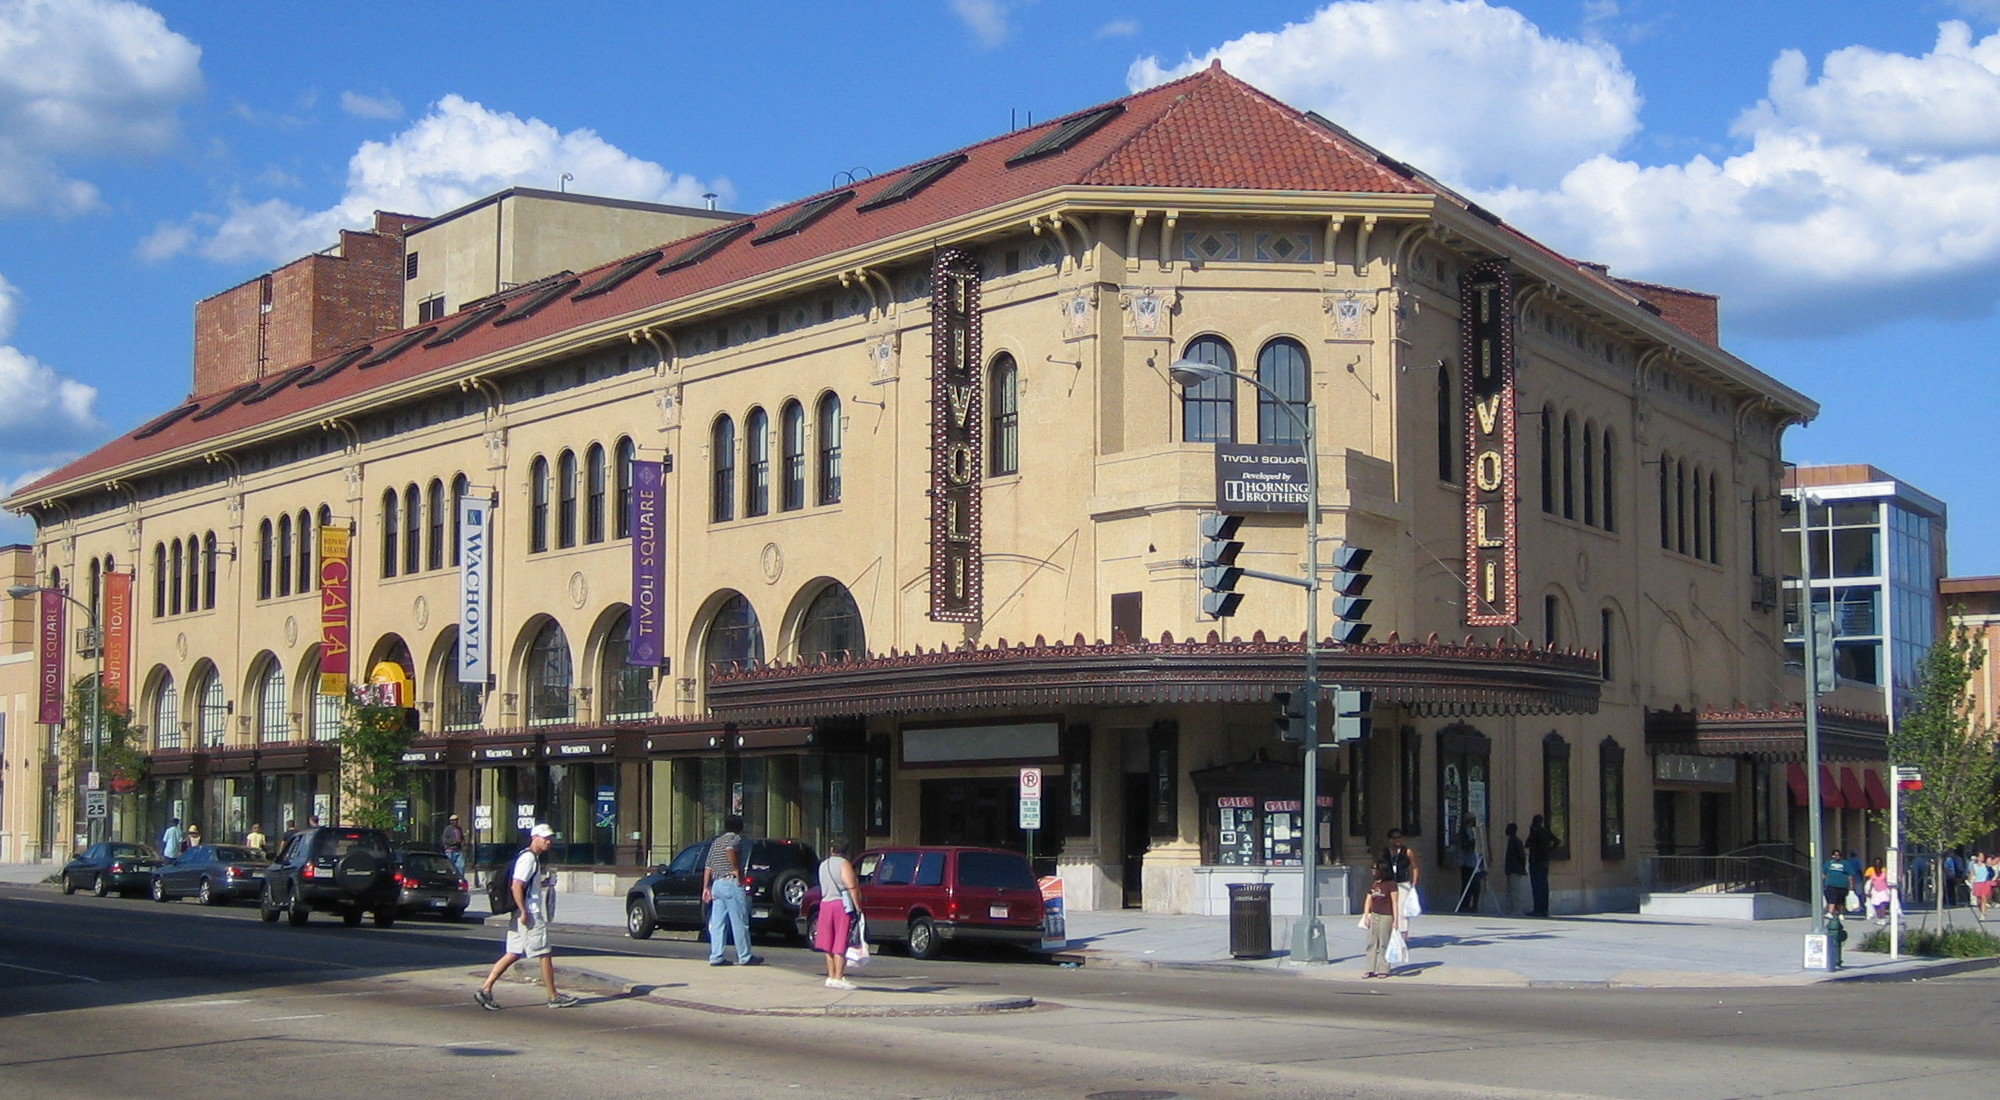
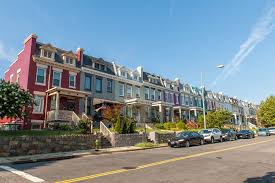

Real Estate in Popular Markets
Browse listings, view neighborhood and market activity in our most popular areas.